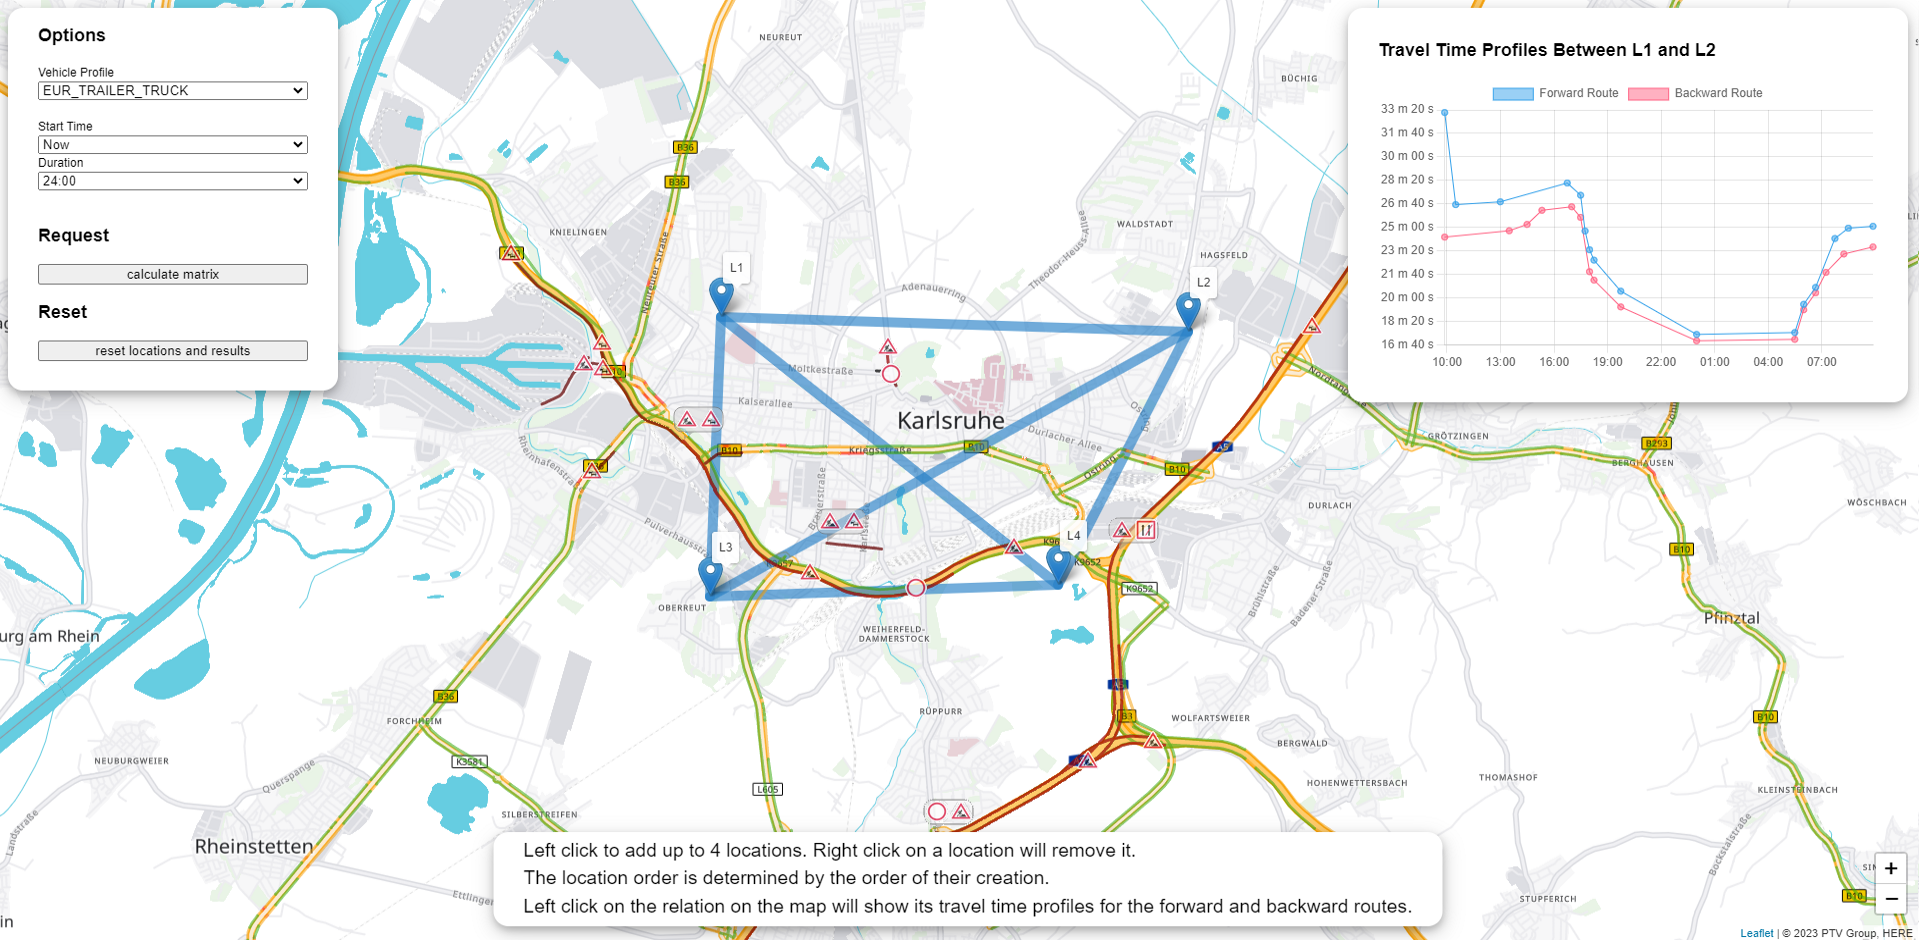
In this tutorial you will learn how our simple Time-Dependent Matrix Calculation App is implemented. This simple application computes a time-dependent matrix with the help of the Matrix Routing API. The resulting travel time profiles of a relation for the forward and backward routes are rendered on a line chart. To focus solely on the core principles, we have implemented a basic error handling only. The objective of the code examples is to illustrate the use of the PTV Developer Matrix Routing API.
Prerequisites
- JavaScript knowledge, including up-to-date knowledge of ES6 features.
- Basic knowledge of JavaScript asynchronous programming using Promises.
- HTML page for displaying PTVs Vector Map with Leaflet. For help, please visit this Quick Start on Vector Maps.
How to use this tutorial
This tutorial is intended to introduce how to use the PTV Developer Matrix Routing API with JavaScript.
Getting started
- Request an API key:
- Register and login at myptv.com
- Activate PTV Developer
- Create your API key
- Download an editor such as Visual Studio Code or Atom which work with HTML and JavaScript.
- Look up more details of requests and responses in the respective reference manual.
- Read the Leaflet reference documentation for further information.
Overview of necessary steps
The following steps are required to compute a time-dependent matrix:
- 1: Create a HTML page.
- 2: Create a style sheet.
- 2: Create a boostrap JavaScript File, adding UI control elements to the map.
- 3: Start an asynchronous matrix calculation.
- 4: Check the progress of the calculation.
- 5: Request the matrix, decode the results and render them on a line chart.
For more detailed information on any specific step, please visit the PTV Developer Matrix Routing API Quick Start.
Create an HTML page to display a map
Create a new HTML file called index.html and initialize a Leaflet map using the code below.
<html>
    <head><title>Time-Dependent Matrix</title>
       <link rel="stylesheet"  type="text/css" href="https://unpkg.com/leaflet@1.7.1/dist/leaflet.css" />
        <link rel="stylesheet" type="text/css" href="https://unpkg.com/maplibre-gl@2.1.7/dist/maplibre-gl.css" />
        <link rel="stylesheet" href="./style.css" />
    </head>

    <body>
        <div id="map"></div>
        <div class='custom-popup' id="custom-popup-id"></div>

        <script type="text/javascript" src="https://unpkg.com/leaflet@1.7.1/dist/leaflet.js" ></script>
        <script type="text/javascript" src="https://unpkg.com/maplibre-gl@2.1.7/dist/maplibre-gl.js" ></script>
        <script type="text/javascript" src="https://unpkg.com/@maplibre/maplibre-gl-leaflet@0.0.15/leaflet-maplibre-gl.js" ></script>
        <script type="text/javascript" src="https://unpkg.com/leaflet-ptv-developer@1.0.1/dist/leaflet-ptv-developer.js" ></script>
        <script type="text/javascript" src="https://cdn.jsdelivr.net/npm/chart.js@4.3.0/dist/chart.umd.min.js"></script>
        <script type="text/javascript" src="https://cdn.jsdelivr.net/npm/chartjs-adapter-date-fns@3.0.0/dist/chartjs-adapter-date-fns.bundle.min.js"></script>
        <script type="text/javascript" src="https://cdn.jsdelivr.net/npm/toastify-js@1.12.0/src/toastify.min.js"></script>
        <script src="./index.js"></script>
    </body>
</html>
Create a style sheet
Create a new style sheet file style.css for the elements displayed later on.
body,
html {
  border: 0;
  padding: 0;
  margin: 0;
}

p {
  font-size: 1vw !important;
  line-height: 1.5vw !important;
}

table, th, td {
  border: 1px solid black;
  border-collapse: collapse;
}

#map {
  width: 100%;
  height: 100%;
}

.routing-control {
  background-color: #ffffff;
  width: 270px;
  padding: 0 30px 30px 30px;
  border-radius: 15px;
  box-shadow: 0 4px 8px 0 rgba(0, 0, 0, 0.2), 0 6px 20px 0 rgba(0, 0, 0, 0.19);
}

.result-control {
  background-color: #ffffff;
  width: 500px;
  padding: 15px 30px 30px 30px;
  border-radius: 15px;
  box-shadow: 0 4px 8px 0 rgba(0, 0, 0, 0.2), 0 6px 20px 0 rgba(0, 0, 0, 0.19);
  visibility: hidden;
}

.chart-container {
  height: 300px;
  min-width: 0;
}

.banner {
  position: fixed;
  left: 50%;
  transform: translateX(-50%);
  bottom: 5px;
  background-color: #ffffff;
  padding-left: 30px;
  padding-right: 30px;
  border-radius: 15px;
  box-shadow: 0 4px 8px 0 rgba(0, 0, 0, 0.2), 0 6px 20px 0 rgba(0, 0, 0, 0.19);
}

.banner p {
  margin-block: 5px;
}

.calc-btn {
  display: block;
  width: 100%;
  text-align: center;
}
Create a booststrap JavaScript file
Create a new JavaScript file called index.js. Add the code below and replace the string "YOUR_API_KEY" with your PTV Developer API key.
After loading the index.html file into a web browser, you should see a panable and zoomable map including traffic patterns and incidents.
const api_key = "YOUR_API_KEY";
let inCalculation = false;
let locations = [];
let startTimeInMillis = null;

//Lazy load the plugin to support right-to-left languages such as Arabic and Hebrew.
maplibregl.setRTLTextPlugin(
  'https://api.mapbox.com/mapbox-gl-js/plugins/mapbox-gl-rtl-text/v0.2.3/mapbox-gl-rtl-text.js',
  null,
  true
);

const coordinate = L.latLng(49, 8.4);
const map = new L.Map('map', {
  center: coordinate,
  zoom: 13,
  maxZoom: 18,
  zoomControl: false
});
L.control.zoom({
  position: 'bottomright'
}).addTo(map);

var vectorStyleUrl = "https://vectormaps-resources.myptv.com/styles/latest/standard.json";

L.maplibreGL({
  attribution: '© ' + new Date().getFullYear() + ' PTV Group, HERE',
  interactive: false,
  maxZoom: 18,
  style: vectorStyleUrl,
  transformRequest: (url) => {
    let transformedUrl = url;
    let mapsPathIndex = url.indexOf('/maps/');

    if (mapsPathIndex > 0) {
      transformedUrl = 'https://api.myptv.com/' + url.substring(mapsPathIndex) + '?apiKey=' + api_key;
      return {
        url: `${transformedUrl}`
      };
    }
    return null;
  }
}).addTo(map);

map.createPane('clickableTiles');
map.getPane('clickableTiles').style.zIndex = 500;
const rasterTileUrl = "https://api.myptv.com/rastermaps/v1/data-tiles/{z}/{x}/{y}";
L.tileLayer.ptvDeveloper(
  rasterTileUrl + '?layers={layers}&apiKey=' + api_key, {
  layers: 'trafficIncidents,trafficPatterns',
  maxZoom: 18,
  opacity: 0.7,
  pane: 'clickableTiles'
}).addTo(map);

const relationLayer = new L.featureGroup().addTo(map);
Add UI Controls and Map Interactions
Add the following code to add controls and basic map interactions. The controls for the request parameters should be now visible and you should be able to click on the map to add up to 4 markers representing the locations to be sent to the matrix calculation.
const toast = Toastify({
  text: "To be set before show!",
  newWindow: true,
  close: false,
  gravity: "top",
  position: "center",
  style: {
    borderBottom: 'thin solid',
    fontFamily: 'sans-serif',
    fontSize: 'x-large',
    textAlign: 'center',
    background: '#f03443'
  }
});

function showToast(text) {
  if (toast.toastElement == null
    || toast.toastElement.className.search(" on") == -1) {
    toast.options.text = text;
    toast.showToast();
  }
  else if (toast.toastElement != null
    && toast.myToast.options.text !== text) {
    toast.hideToast();
    toast.options.text = text;
    toast.showToast();
  }
}

map.on('click', onMapClick);

const profiles = ['EUR_TRAILER_TRUCK', 'EUR_TRUCK_40T', 'EUR_TRUCK_11_99T', 'EUR_TRUCK_7_49T', 'EUR_VAN', 'EUR_CAR',
  'USA_1_PICKUP', 'USA_5_DELIVERY', 'USA_8_SEMITRAILER_5AXLE', 'AUS_LCV_LIGHT_COMMERCIAL', 'AUS_MR_MEDIUM_RIGID', 'AUS_HR_HEAVY_RIGID',
  'IMEA_TRUCK_40T', 'IMEA_TRUCK_7_49T', 'IMEA_VAN', 'IMEA_CAR'];

const startTimes = ['Now', '00:00', '01:00', '02:00', '03:00', '04:00', '05:00', '06:00', '07:00', '08:00', '09:00', '10:00',
  '11:00', '12:00', '13:00', '14:00', '15:00', '16:00', '17:00', '18:00', '19:00', '20:00', '21:00', '22:00', '23:00'];

const durations = [['03:00', 10800], ['06:00', 21600], ['12:00', 43600], ['24:00', 86400]];

addControls();

addResultControl();
addDescriptionBanner();
const chart = addChart();

function onMapClick(e) {
  if (inCalculation == true) {
    return;
  }
  if (locations.length < 4) {
    const title = "L" + (locations.length + 1);
    const marker = L.marker(e.latlng).bindTooltip(title, { permanent: true, direction: 'top' }).addTo(map);

    locations.push(marker);
    marker.on('contextmenu', removeMarker);
  }
  else {
    showToast("Only 4 locations are allowed in this tutorial.");
  }
}

function renameMarkers() {
  map.eachLayer((layer) => {
    if (layer instanceof L.Marker) {
      layer.unbindTooltip();
      const locationsIndex = locations.findIndex(l => l._latlng === layer._latlng);
      layer.bindTooltip('L' + (locationsIndex + 1), { permanent: true, direction: 'top' });
    }
  });
}

function removeMarker(e) {
  if (inCalculation == true) {
    return;
  }
  map.eachLayer((layer) => {
    if (layer instanceof L.Marker && layer._latlng === e.latlng) {
      layer.remove();
      clearResults();
      locations.splice(locations.findIndex(l => l._latlng === e.latlng), 1);
    }
  });
  renameMarkers();
}

function removeAllMarker() {
  map.eachLayer((layer) => {
    if (layer instanceof L.Marker) {
      layer.remove();
    }
  });
}

function addControls() {
  const routingControl = L.control({ position: 'topleft' });
  routingControl.onAdd = function (map) {
    const div = L.DomUtil.create('div', 'routing-control');
    const html = `
              <h2>Options</h2>
              <div>
                  <div>
                      <label for="vehicleProfile" style="display: block;">Vehicle Profile</label>
                      <select name="vehicleProfile" id="vehicleProfile" style="display: block; width: 100%;">
                          ${profiles.map((profile) => {
      return `<option value="${profile}">${profile}</option>`;
    }).join("")}
                      </select>
                  </div>
                  <br/>
                  <div>
                      <label for="startTime" style="display: block;">Start Time</label>
                      <select name="startTime" id="startTime" style="display: block; width: 100%;">
                          ${startTimes.map((startTime) => {
      return `<option value="${startTime}">${startTime}</option>`;
    }).join("")}
                      </select>
                  </div>
                  <div>
                      <label for="duration" style="display: block;">Duration</label>
                      <select name="duration" id="duration" style="display: block; width: 100%;">
                          ${durations.map((duration) => {
      return `<option ${duration[0] === '24:00' ? 'selected' : ''} value="${duration[1]}">${duration[0]}</option>`;
    }).join("")}
                      </select>
                  </div>
                  <br />
                  <h2>Request</h2>
                  <button type="button" id="btnSendRequest" class="calc-btn">calculate matrix</button>
                  <h2>Reset</h2>
                  <button type="button" id="btnResetEverything" class="calc-btn">reset locations and results</button>
              </div>
      `;
    div.innerHTML = html;

    L.DomEvent.disableScrollPropagation(div);
    L.DomEvent.disableClickPropagation(div);

    return div;
  };
  routingControl.addTo(map);
  document.getElementById('btnSendRequest').addEventListener('click', calculateMatrixAsynchronous);
  document.getElementById('btnResetEverything').addEventListener('click', clearResultsAndLocations);
}

function addChart() {
  const toHHMMSS = (numSecs) => {
    const hours = Math.floor(numSecs / 3600)
      .toString();
    const minutes = Math.floor((numSecs - hours * 3600) / 60)
      .toString()
      .padStart(2, "0");
    const seconds = (numSecs - hours * 3600 - (minutes * 60))
      .toString()
      .padStart(2, "0");
    return '0' === hours ? `${minutes} m ${seconds} s` : `${hours} h ${minutes} m ${seconds} s`;
  };

  const ctx = document.getElementById('chart');
  let chart = new Chart(ctx, {
    type: 'line',
    data: {
      datasets: [{
        label: 'Forward Route',
        borderWidth: 1
      }, {
        label: 'Backward Route',
        borderWidth: 1
      }]
    },
    options: {
      maintainAspectRatio: false,
      plugins: {
        title: {
          display: false,
          font: {
            weight: 'bold',
            size: 16
          },
          text: ""
        },
        tooltip: {
          callbacks: {
            label: function (context) {
              let label = context.dataset.label || '';

              if (label) {
                label += ': ';
              }
              if (context.parsed.y !== null) {
                label += toHHMMSS(context.parsed.y);
              }
              return label;
            }
          }
        }
      },
      scales: {
        x: {
          type: 'time',
          time: {
            unit: 'hour',
            tooltipFormat: 'HH:mm',
            displayFormats: {
              hour: 'HH:mm'
            }
          },
          parsing: false,
          ticks: {
            display: false,
            source: 'auto',
            autoSkip: true,
            maxTicksLimit: 8
          }
        },
        y: {
          beginAtZero: false,
          ticks: {
            display: false,
            callback: function (value, index, ticks) {
              return toHHMMSS(value);
            }
          }
        }
      }
    }
  });
  return chart;
}

function resetChart() {
  document.getElementById('chart-title').innerHTML = "";
  chart.data.datasets[0].data = [];
  chart.data.datasets[1].data = [];
  chart.options.scales.x.ticks.display = false;
  chart.options.scales.y.ticks.display = false;
  chart.update();
}

function addResultControl() {
  const resultControl = L.control({ position: 'topright' });
  resultControl.onAdd = function (map) {
    const div = L.DomUtil.create('div', 'result-control');
    const html = `
              <h2 id="chart-title"></h2>
              <div class="chart-container">
                <canvas id="chart"></canvas>
              </div>
          `;
    div.innerHTML = html;

    L.DomEvent.disableScrollPropagation(div);
    L.DomEvent.disableClickPropagation(div);

    return div;
  };

  resultControl.addTo(map);
}

function addDescriptionBanner() {
  const banner = L.control({ position: 'bottomleft' });
  banner.onAdd = function (map) {
    const div = L.DomUtil.create('div', 'banner');
    const html = `
              <p>
                  Left click to add up to 4 locations. Right click on a location will remove it.<br>
                  The location order is determined by the order of their creation.<br>
                  Left click on the relation on the map will show its travel time profiles for the forward and backward routes.
              </p>
          `;
    div.innerHTML = html;

    L.DomEvent.disableScrollPropagation(div);
    L.DomEvent.disableClickPropagation(div);

    return div;
  };
  banner.addTo(map);
}

function clearResults() {
  var resultControl = document.getElementsByClassName('result-control')[0];
  resultControl.style.visibility = 'hidden';
  relationLayer.clearLayers();
  resetChart();
}

function clearResultsAndLocations() {
  clearResults();
  removeAllMarker();
  locations.length = 0;
}

async function calculateMatrixAsynchronous() {
  // will be completed in the last step
}
Start an asynchronous matrix calculation
Add the following code to start a matrix calculation with the chosen options and locations.
async function startMatrixCalculation() {
  if (locations.length <= 1) {
    return null;
  }
  else {
    return fetch(
      "https://api.myptv.com/matrixrouting/v1/matrices/async" + getMatrixParameter(),
      {
        method: 'POST',
        headers: {
          'Content-Type': 'application/json',
          'apiKey': api_key
        },
        body: getMatrixBody()
      }
    ).then((response) => response.ok ? response.json() : console.log(response))
  }
}

function getMatrixParameter() {
  const getStartTime = () => {
    const formElement = document.getElementById('startTime');
    const now = new Date();
    const operator = now.getTimezoneOffset() <= 0 ? "%2B" : "-";
    const modificator = now.getTimezoneOffset() <= 0 ? -1 : 1;
    var utcOffsetHours = Math.floor((now.getTimezoneOffset() * modificator) / 60);
    var utcOffsetMin = (now.getTimezoneOffset() * modificator) - (utcOffsetHours * 60);
    now.setHours(now.getHours() + utcOffsetHours);
    now.setMinutes(now.getMinutes() + utcOffsetMin);
    if (utcOffsetHours < 10)
      utcOffsetHours = "0" + utcOffsetHours;
    if (utcOffsetMin < 10)
      utcOffsetMin = "0" + utcOffsetMin;
    const offsetString = operator + utcOffsetHours + ":" + utcOffsetMin;
    if (formElement.value === "Now") {
      var isoString = now.toISOString().replace("Z", "");
      isoString += offsetString;
      return isoString;
    } else {
      var dateString = now.toISOString().split("T")[0] + "T" + formElement.value + ":00";
      dateString += offsetString;
      return dateString;
    }
  }

  const startTime = getStartTime();
  startTimeInMillis = new Date(startTime.replace("%2B", "+")).getTime();
  let query = '?options[resultFormat]=ENCODED&options[trafficMode]=REALISTIC';
  query += `&profile=${document.getElementById('vehicleProfile').value}`;
  query += `&options[startTime]=${startTime}`;
  query += `&options[duration]=${document.getElementById('duration').value}`;
  return query;
}

function getMatrixBody() {
  let body = '{"origins": [';
  position = 0;
  locations.forEach((location) => {
    if (position != 0) {
      body += ',';
    }
    body += '{"latitude":' + location._latlng.lat + ',"longitude":' + location._latlng.lng + '}';
    position += 1;
  });
  body += ']}';
  return body;
}
Check the progress of the calculation
Add the following code to check the progress of the calculation.
function sleep(ms) {
  return new Promise(resolve => setTimeout(resolve, ms));
}

// polls the status until it is not "RUNNING" any more
async function getMatrixCalculationStatus(requestId) {
  var status = "RUNNING";
  while (status == "RUNNING") {
    await sleep(100);
    fetch(
        "https://api.myptv.com/matrixrouting/v1/matrices/status/" + requestId, {
          method: 'GET',
          headers: {
            'Content-Type': 'application/json',
            'ApiKey': api_key
          }
        }
    )
    .then((response) => response.json()
        .then((result) => {
          status = result.status;
        })
        .catch(err => {console.log(err.message); status = "exitnow";})
    );
  }
  return status;
}
Request the matrix, decode the results and render them on a line chart
Add the following code to request the matrix and display result on map and controls.
function getMatrixResult(requestId) {
  fetch(
    "https://api.myptv.com/matrixrouting/v1/matrices/" + requestId,
    {
      method: 'GET',
      headers: {
        'Content-Type': 'application/json',
        'apiKey': api_key
      }
    }
  )
    .then((response) => response.json()
      .then((result) => {
        const travelTimeProfiles = decodeTravelTimeProfiles(result.travelTimeProfilesEncoded);
        displayResults(travelTimeProfiles);
      })
      .catch(err => console.log(err.message)))
}

// the byteArray is encoded in base64
// getBytes makes conversion from base64 to Uint8Array
function getBytes(byteArray) {
  var decoded = atob(byteArray);
  var i, il = decoded.length;
  var array = new Uint8Array(il);
  for (i = 0; i < il; ++i) {
    array[i] = decoded.charCodeAt(i);
  }
  return array;
};

function decodeTravelTimeProfiles(encodedArray) {
  let bytes = getBytes(encodedArray);
  var view = new DataView(bytes.buffer);
  var profiles = [];
  var offset = 0;
  while (offset < bytes.length) {
    var minimumTravelTime = view.getUint32(offset, true) / 1000.0;
    var n = view.getUint8(offset + 4);
    offset += 5;
    var profile = [];
    for (var i = 0; i < n; ++i) {
      var x = view.getUint16(offset, true);
      var y = view.getUint16(offset + 2, true);
      profile.push([x, Math.round(minimumTravelTime + y)]);
      offset += 4;
    }
    profiles.push(profile);
  }
  return profiles;
}

function displayResults(travelTimeProfiles) {
  var resultControl = document.getElementsByClassName('result-control')[0];
  resultControl.style.visibility = 'visible';

  const relationStyle = {
    'color': '#2882C8',
    'weight': 10,
    'opacity': 0.65
  };

  for (let source = 0; source < locations.length; source++) {
    for (let destination = source + 1; destination < locations.length; destination++) {
      let layer = L.polyline([locations[source]._latlng, locations[destination]._latlng], relationStyle);
      layer.on('click', (ev) => {
        L.DomEvent.stopPropagation(ev);
        updateChart(source, destination, travelTimeProfiles);
      });
      relationLayer.addLayer(layer);
    }
  }

  map.fitBounds(relationLayer.getBounds(), { padding: [50, 50] });

  updateChart(0, 1, travelTimeProfiles);
}

function updateChart(source, destination, travelTimeProfiles) {
  document.getElementById('chart-title').innerHTML = `Travel Time Profiles Between L${source + 1} and L${destination + 1}`;
  chart.data.datasets[0].data = [];
  chart.data.datasets[1].data = [];
  chart.options.scales.x.ticks.display = true;
  chart.options.scales.y.ticks.display = true;
  const forwardRelationIdx = source * locations.length + destination;
  const backwardRelationIdx = destination * locations.length + source;
  let toMillisSinceEpoch = (value) => startTimeInMillis + value * 60 * 1000;
  travelTimeProfiles[forwardRelationIdx].forEach(el => {
    chart.data.datasets[0].data.push({ x: toMillisSinceEpoch(el[0]), y: el[1] });
  })
  travelTimeProfiles[backwardRelationIdx].forEach(el => {
    chart.data.datasets[1].data.push({ x: toMillisSinceEpoch(el[0]), y: el[1] });
  })
  chart.update();
}
Replace implementation of function calculateMatrixAsynchronous()
Now just make everything work together by implementing function calculateMatrixAsynchronous(). So replace the empty implementation with the following. Then choose some locations, push the button "Calculate Matrix" and enjoy your first calculated travel time profiles.
async function calculateMatrixAsynchronous() {
  inCalculation = true;
  document.getElementById('btnSendRequest').disabled = true;
  document.getElementById('btnResetEverything').disabled = true;
  document.body.style.cursor = 'wait';

  clearResults();
  const responseStart = await startMatrixCalculation();
  if (responseStart == null) {
    document.body.style.cursor = 'default';
    document.getElementById('btnSendRequest').disabled = false;
    document.getElementById('btnResetEverything').disabled = false;
    inCalculation = false;
    return;
  }
  var status = await getMatrixCalculationStatus(responseStart.id);
  if (status !== "SUCCEEDED") {
    showToast("calculation status: " + status);
  }
  else {
    getMatrixResult(responseStart.id);
  }

  document.body.style.cursor = 'default';
  document.getElementById('btnSendRequest').disabled = false;
  document.getElementById('btnResetEverything').disabled = false;
  inCalculation = false;
}