 In this tutorial you will learn how an Emission Calculation App is implemented. PTV Developer Routing API.
Prerequisites
- Basic JavaScript knowledge.
- Basic knowledge of JavaScript asynchronous programming using Promises.
- Helpful: Basic knowledge of jQuery. A page like the W3 Schools jQuery tutorial is sufficient.
How to use this tutorial
The tutorial will start similar to a cooking recipe. After the basic steps how to create the app are explained, the tutorial will focus on the major building blocks.
Getting started
- Request an API key:
- Register and login at myptv.com
- Activate PTV Developer
- Create your API key
- Download an editor like Visual Studio Code or Atom to work on HTML and JavaScript.
- Look up more details of requests and responses in the respective reference manual.
- Read the Leaflet reference documentation for further information.
Create an HTML page to display a map
Create a new HTML file called index.html and initialize a Leaflet map using the code below.
<?xml version="1.0" encoding="utf-8"?>
<html>
    <head><title>Emission Calculation</title>
        <link rel="stylesheet" href="https://unpkg.com/leaflet@1.6.0/dist/leaflet.css" />
        <link rel="stylesheet" href="./style.css" />
		<link rel="icon" href="../../favicon.ico" />
        <script src="https://unpkg.com/leaflet@1.6.0/dist/leaflet.js"></script>
        <script src="https://developer-applications.myptv.com/Tutorials/common/jquery.min.js"></script>
        <script src="https://developer-applications.myptv.com/Tutorials/common/convertTime.js"></script>
        <script src="https://developer-applications.myptv.com/Tutorials/common/convertDistance.js"></script>
        <script src="./headerTileLayer.js"></script>
        <script src="./index.js"></script>
    </head>
    <body>
        <div id="map"></div>
    </body>
</html>
Create JavaScript File
Create a new JavaScript file called index.js. Add the code below and replace the string "YOUR_API_KEY" with your PTV Developer API key. After loading the index.html file into a web browser, you should see a panable and zoomable map.
const api_key = "YOUR_API_KEY";
const tileURL = "https://api.myptv.com/rastermaps/v1/image-tiles/{z}/{x}/{y}?size={tileSize}";
const routesURL = "https://api.myptv.com/routing/v1/routes";
const predefinedProfilesURL = "https://api.myptv.com/data/v1/vehicle-profiles/predefined";

$(document).ready(function () {
  const coordinate = L.latLng(49, 8.4);

  const map = new L.Map("map", {
    center: coordinate,
    zoom: 13,
    zoomControl: false,
  });

  L.control.zoom({ position: "bottomright" }).addTo(map);

  L.tileLayer(tileURL, {
      attribution: "© " + new Date().getFullYear() + ", PTV Group, HERE",
      tileSize: 256,
      trackResize: false,
    },
    [{ header: "ApiKey", value: api_key }]
  ).addTo(map);
});
Explanation of the important code lines
This jQuery expression indicates that the code inside the curly brackets is executed only if the root index.html file is completely loaded.
$(document).ready(function() {
    ...
});
The first argument given to the L.Map constructor references the DOM element with the id map. The following lines show how a leaflet map control like zooming is created.
const map = new L.Map("map", {
  center: coordinate,
  zoom: 13,
  zoomControl: false,
});

L.control.zoom({ position: "bottomright" }).addTo(map);
The expressions {z}/{x}/{y} in the tileURL are placeholders which are replaced by default.
const tileURL = `https://api.myptv.com/rastermaps/v1/image-tiles/{z}/{x}/{y}?apiKey=${api_key}`;More information on this can be found in the Raster Maps API Documentation
All other replacements have to be defined in the constructor parameters of L.tileLayer.
L.tileLayer(tileURL, {
    attribution: "© " + new Date().getFullYear() + ", PTV Group, HERE",
    tileSize: 256,
    trackResize: false,
  },
  [{ header: "ApiKey", value: api_key }]
).addTo(map);
The rendered HTML page constitutes already an interactive zoom-able and pan-able map. The next section shows how to create input controls for start and destination.
Adding Waypoints to the Map
To set waypoints on the map a event handler has to be registered:
$(document).ready(function () {
    ...
    map.on('click', onMapClick);
Then implement the event handler. Additionally, an event handler for the waypoint is implemented. It triggers when right clicking a waypoint and removes it. The function calculateRoute() will be implemented later to calculate the route after adding or removing waypoints.
function onMapClick(e) {
    const marker = L.marker(e.latlng).addTo(map);
    marker.on("contextmenu", removeMarker);
    calculateRoute();
}
function removeMarker(e) {
  map.eachLayer((layer) => {
    if (layer instanceof L.Marker && layer._latlng === e.latlng) {
      layer.remove();
    }
  });
  calculateRoute();
}
Adding controls to manipulate the emission calculation
Beginning from this step, we will focus on the most important chunks of the source code.
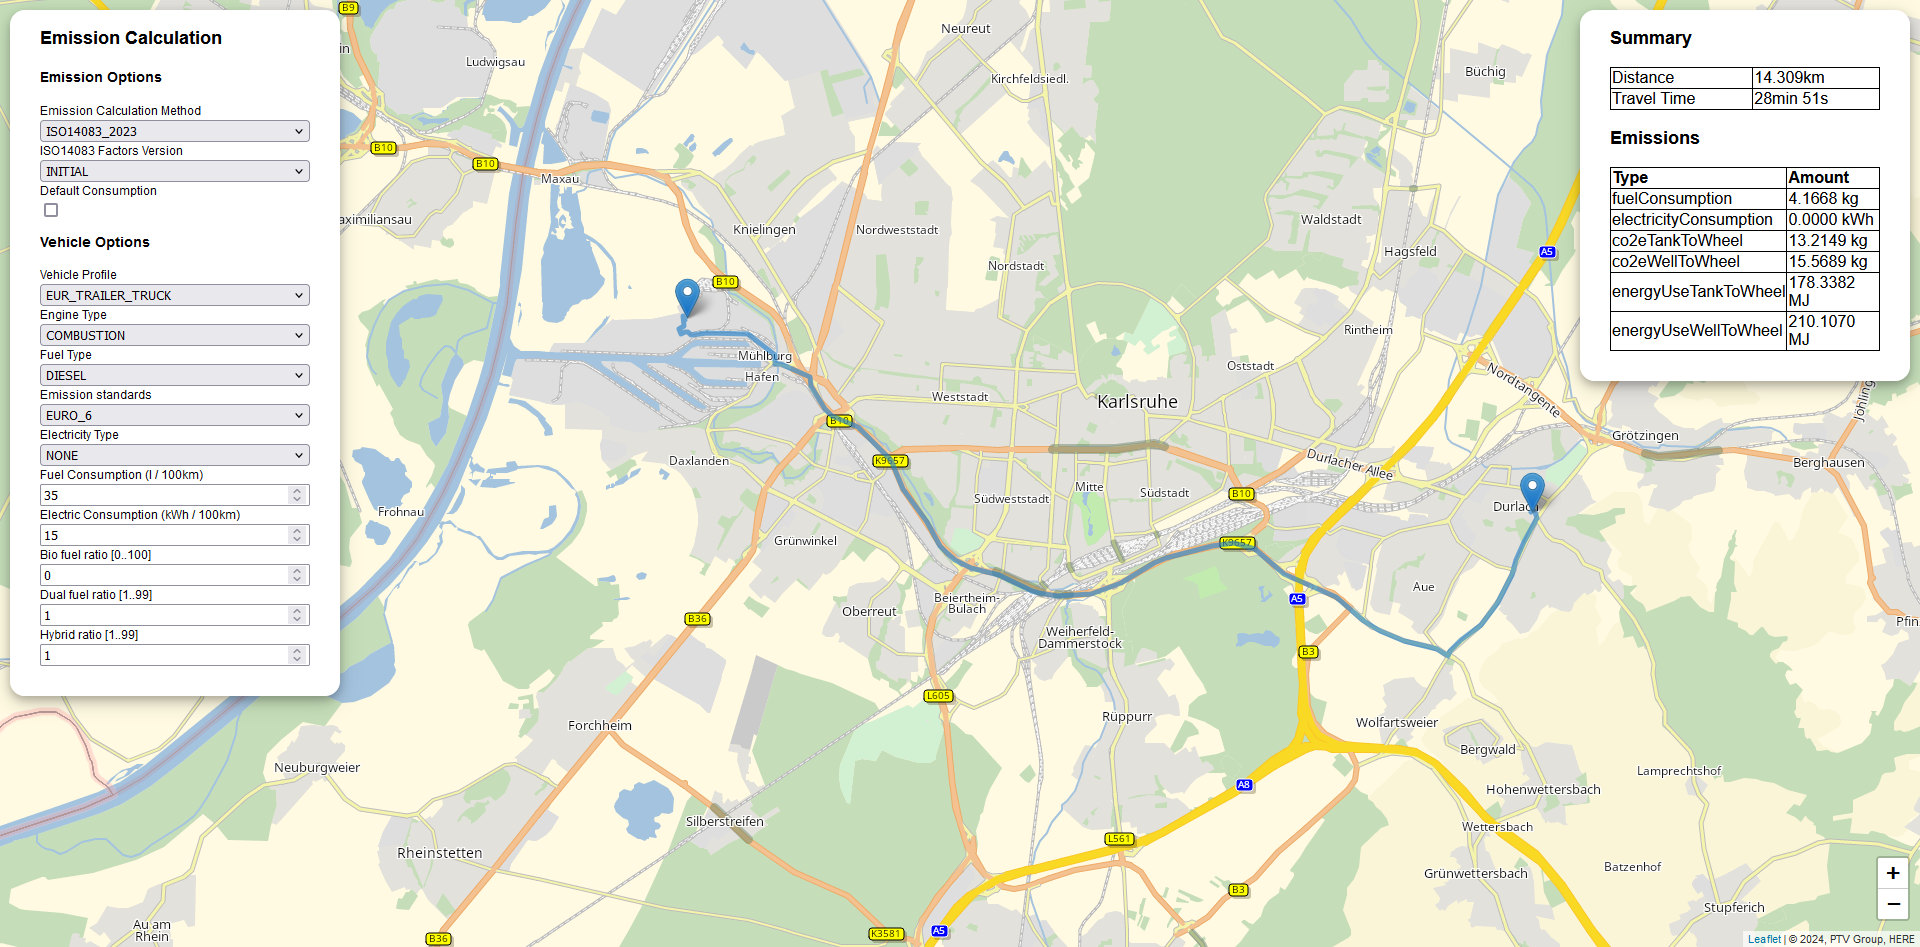
The function addControls() adds inputs to configure the emission and the vehicle options. The vehicle profiles available in the dropdown are automatically loaded from the predefined profiles available at the Data API.
After creating the control panel, we add event listeners on the input fields that trigger route calculations on changes to the fields. The functions used there will be implemented later.
$(document).ready(function () {
  ...
  fetch(predefinedProfilesURL, {method: "GET", headers: {apiKey: api_key}})
    .then((response) => response.json())
    .then((response, error) => {
      if (error) {
        console.log(error);
      } else {
        profiles = response.profiles.filter((p) => p.name !== "PEDESTRIAN" && p.name !== "BICYCLE");
        addControls();
      }
    });

  function addControls() {
    const routingControl = L.control({ position: "topleft" });
    routingControl.onAdd = function (map) {
      const div = L.DomUtil.create("div", "routing-control");
      const html = `
            <h2>Emission Calculation</h2>
            <div>
                <h3>Emission Options</h3>
                <div>
                    <label for="emissionCalculationMethod" style="display: block;">Emission Calculation Method</label>
                    <select name="emissionCalculationMethod" id="emissionCalculationMethod" style="display: block; width: 100%;">
                        <option value="ISO14083_2023">ISO14083_2023</option>
                        <option value="EN16258_2012">EN16258_2012</option>
                        <option value="FRENCH_CO2E_DECREE_2017_639">FRENCH_CO2E_DECREE_2017_639</option>
                    </select>
                </div>
                <div>
                    <label for="emissionVersion" style="display: block;">ISO14083 Factors Version</label>
                    <select name="emissionVersion" id="emissionVersion" style="display: block; width: 100%;">
                        <option value="INITIAL">INITIAL</option>
                        <option value="VERSION_2">VERSION_2</option>
                        <option value="LATEST">LATEST</option>
                    </select>
                </div>
                <div>
                    <label for="defaultConsumption" style="display: block;">Default Consumption</label>
                    <input type="checkbox" name="defaultConsumption" id="defaultConsumption" style="display: block;"/>
                </div>
                <h3>Vehicle Options</h3>
                <div>
                    <label for="vehicleProfile" style="display: block;">Vehicle Profile</label>
                    <select name="vehicleProfile" id="vehicleProfile" style="display: block; width: 100%;">
                        ${profiles.map((profile) => `<option value="${profile.name}">${profile.name}</option>`)}
                    </select>
                </div>
                <div>
                    <label for="engineType" id="engineTypeLabel" style="display: block;">Engine Type</label>
                    <select name="engineType" id="engineType" style="display: block; width: 100%;">
                        <option value="COMBUSTION">COMBUSTION</option>
                        <option value="HYBRID">HYBRID</option>
                        <option value="ELECTRIC">ELECTRIC</option>
                    </select>
                </div>
                <div>
                    <label for="fuelType" id="fuelTypeLabel" style="display: block;">Fuel Type</label>
                    <select name="fuelType" id="fuelType" style="display: block; width: 100%;">
                        <option value="DIESEL">DIESEL</option>
                        <option value="GASOLINE">GASOLINE</option>
                        <option value="COMPRESSED_NATURAL_GAS">COMPRESSED_NATURAL_GAS</option>
                        <option value="LIQUEFIED_PETROLEUM_GAS">LIQUEFIED_PETROLEUM_GAS</option>
                        <option value="LIQUEFIED_NATURAL_GAS">LIQUEFIED_NATURAL_GAS</option>
                        <option value="CNG_GASOLINE">CNG_GASOLINE</option>
                        <option value="LPG_GASOLINE">LPG_GASOLINE</option>
                        <option value="ETHANOL">ETHANOL</option>
                        <option value="NONE">NONE</option>
                    </select>
                </div>
                <div>
                  <label for="emissionStandards" id="emissionStandardsLabel" style="display: block;">Emission standards</label>
                  <select name="emissionStandards" id="emissionStandards" style="display: block; width: 100%;">
                      <option value="EURO_0">EURO_0</option>
                      <option value="EURO_1">EURO_1</option>
                      <option value="EURO_2">EURO_2</option>
                      <option value="EURO_3">EURO_3</option>
                      <option value="EURO_4">EURO_4</option>
                      <option value="EURO_5">EURO_5</option>
                      <option value="EURO_EEV">EURO_EEV</option>
                      <option value="EURO_6" selected>EURO_6</option>
                      <option value="EURO_6C">EURO_6C</option>
                      <option value="EURO_6D_TEMP">EURO_6D_TEMP</option>
                      <option value="EURO_6D">EURO_6D</option>
                      <option value="EURO_6E">EURO_6E</option>
                      <option value="EURO_7">EURO_7</option>
                      <option value="NONE">NONE</option>
                  </select>
                </div>
                <div>
                    <label for="electricityType" id="electricityTypeLabel" style="display: block;">Electricity Type</label>
                    <select name="electricityType" id="electricityType" style="display: block; width: 100%;">
                        <option value="BATTERY">BATTERY</option>
                        <option value="HYDROGEN_FUEL_CELL">HYDROGEN_FUEL_CELL</option>
                        <option value="NONE" selected>NONE</option>
                    </select>
                </div>
                <div>
                    <label for="averageFuelConsumption" id="averageFuelConsumptionLabel" style="display: block;">Fuel Consumption (l / 100km)</label>
                    <input type="number" id="averageFuelConsumption" name="averageFuelConsumption" style= "width: 100%;"
                    min="1" step="1" value="35" max="100">
                </div>
                <div>
                    <label for="averageElectricityConsumption" id="averageElectricityConsumptionLabel" style="display: block;">Electric Consumption (kWh / 100km)</label>
                    <input type="number" id="averageElectricityConsumption" name="averageElectricityConsumption" style= "width: 100%;"
                    min="1" step="1" value="15" max="100">
                </div>
                <div>
                    <label for="bioFuelRatio" id="bioFuelRatioLabel" style="display: block;">Bio fuel ratio [0..100]</label>
                    <input type="number" id="bioFuelRatio" name="bioFuelRatio" style= "width: 100%;"
                    min="1" step="1" value="0" max="100">
                </div>
                <div>
                    <label for="dualFuelRatio" id="dualFuelRatioLabel" style="display: block;">Dual fuel ratio [1..99]</label>
                    <input type="number" id="dualFuelRatio" name="dualFuelRatio" style= "width: 100%;"
                    min="1" step="1" value="1" max="99">
                </div>
                <div>
                    <label for="hybridRatio" id="hybridRatioLabel" style="display: block;">Hybrid ratio [1..99]</label>
                    <input type="number" id="hybridRatio" name="hybridRatio" style= "width: 100%;"
                    min="1" step="1" value="1" max="99">
                </div>
            </div>
    `;
      div.innerHTML = html;

      L.DomEvent.disableScrollPropagation(div);
      L.DomEvent.disableClickPropagation(div);

      return div;
    };
    routingControl.addTo(map);
    document.getElementById("emissionCalculationMethod").addEventListener("change", onEmissionCalculationMethodChanged);
    document.getElementById("vehicleProfile").addEventListener("change", onVehicleProfileChanged);
    const routeCalculationTriggers = ["emissionVersion", "defaultConsumption", "engineType", "fuelType",
      "emissionStandards", "electricityType", "averageFuelConsumption", "averageElectricityConsumption", "dualFuelRatio",
      "bioFuelRatio", "hybridRatio"];
    routeCalculationTriggers.forEach(id => document.getElementById(id).addEventListener("change", calculateRoute));
  }
Call the PTV Routing API
With calculateRoute(), a call to the PTV Routing API is made.
function calculateRoute() {
  const waypoints = [];
  map.eachLayer((layer) => {
    if (layer instanceof L.Marker) {
      waypoints.push(layer._latlng);
    }
  });
  if (waypoints.length > 1) {
    fetch(routesURL + getQuery(waypoints),
      { method: "GET", headers: { "Content-Type": "application/json", apiKey: api_key } }
    ).then((response) =>
      response.json().then((result) => {
        clearResults();
        displayPolyline(JSON.parse(result.polyline));
        displayResults(result);
      })
    );
  } else {
    clearResults();
  }
}
Explaination of the important code lines
First all Waypoints are found by retrieving their coordinates from leaflet's map layers. Then, if there are two or more waypoints the Routing API is called.
The function getQuery() returns the query for the request.
function getQuery(waypoints) {
  let query = "?results=POLYLINE";

  query += "&emissionOptions[calculationMethods]=" + document.getElementById("emissionCalculationMethod").value;
  query += "&emissionOptions[iso14083EmissionFactorsVersion]=" + document.getElementById("emissionVersion").value;
  query += "&emissionOptions[defaultConsumption]=" + document.getElementById("defaultConsumption").checked;

  query += "&profile=" + document.getElementById("vehicleProfile").value;
  query += "&vehicle[averageElectricityConsumption]=" + document.getElementById("averageElectricityConsumption").value;
  query += "&vehicle[engineType]=" + document.getElementById("engineType").value;
  query += "&vehicle[electricityType]=" + document.getElementById("electricityType").value;
  query += "&vehicle[dualFuelRatio]=" + document.getElementById("dualFuelRatio").value;
  query += "&vehicle[emissionStandard]=" + document.getElementById("emissionStandards").value;
  query += "&vehicle[bioFuelRatio]=" + document.getElementById("bioFuelRatio").value;
  query += "&vehicle[hybridRatio]=" + document.getElementById("hybridRatio").value;
  query += "&vehicle[averageFuelConsumption]=" + document.getElementById("averageFuelConsumption").value;
  query += "&vehicle[fuelType]=" + document.getElementById("fuelType").value;

  waypoints.forEach((waypoint) => {
    query += "&waypoints=" + waypoint.lat + "," + waypoint.lng;
  });
  return query;
}
After the fetch method is finished, the response will then be converted to JSON. In the next line, the polyline will be displayed on the map.
.then((response) =>
  response.json().then((result) => {
    clearResults();
    displayPolyline(JSON.parse(result.polyline));
    displayResults(result);
  })
);
The function displayPolyline contains the style of the polyline. We use the polyline in the geoJSON format as provided by the response of the routing API call.
var polylineLayer = null;

function displayPolyline(polyline) {
  polylineLayer = L.geoJSON(polyline,
    {style: { color: "#2882C8", weight: 5, opacity: 0.65 }}
  ).addTo(map);

  map.fitBounds(polylineLayer.getBounds());
}
When changing Emission Calculation Method we use a function onEmissionOptionChanged to enable or disable some input fields before calculating the route, because not possible inputs apply to all Calculation Methods. Similarly we use onVehicleProfileChanged to set the value of fuelType and averageFuelConsumption to the value defined in the predefined profiles before calculating a route.
function onEmissionOptionChanged() {
  const calculationMethod = document.getElementById("emissionCalculationMethod").value;
  document.getElementById("emissionVersion").disabled = calculationMethod !== "ISO14083_2023";
  document.getElementById("defaultConsumption").disabled = calculationMethod === "FRENCH_CO2E_DECREE_2017_639";
  calculateRoute();
}

function onVehicleProfileChanged() {
  const profileName = document.getElementById("vehicleProfile").value;
  const profile = profiles.find((e) => e.name === profileName);
  if (profile?.vehicle?.fuelType && profile?.vehicle?.averageFuelConsumption) {
    document.getElementById("fuelType").value = profile.vehicle.fuelType;
    document.getElementById("averageFuelConsumption").value = profile.vehicle.averageFuelConsumption;
  }
  calculateRoute();
}
Add Stylesheet
Create a new file called style.css. and put the following code in it.
body,
html {
    border: 0;
    padding: 0;
    margin: 0;
}

p {
    font-size: 1vw !important;
    line-height: 1.5vw !important;
}

table, th, td {
    border: 1px solid black;
    border-collapse: collapse;
}

#map {
    width: 100%;
    height: 100%;
}

.routing-control {
    background-color: #ffffff;
    width: 270px;
    padding: 0 30px 30px 30px;
    border-radius: 15px;
    box-shadow: 0 4px 8px 0 rgba(0, 0, 0, 0.2), 0 6px 20px 0 rgba(0, 0, 0, 0.19);
}

.result-control,
.result-control-left,
.summary-control {
    background-color: #ffffff;
    width: 300px;
    min-height: 60px;
    padding: 0 30px 30px 30px;
    border-radius: 15px;
    box-shadow: 0 4px 8px 0 rgba(0, 0, 0, 0.2), 0 6px 20px 0 rgba(0, 0, 0, 0.19);
}

.result-control-left,
.summary-control {
    width: 270px;
}

#emissionsCostsTable,
#summaryTable {
    width: 100%;
}
How to display the result
To display the result, a control can be added to the map as previously done in the step Adding controls to manipulate the emission calculation. As example, the emissions metrics will be displayed.
$(document).ready(function () {
  ...
  const resultControl = L.control({ position: "topright" });
  resultControl.onAdd = function (map) {
    const div = L.DomUtil.create("div", "result-control-left");
    const html = `
          <h2>Summary</h2>
          <div id="summaryTableWrapper">
              <table id="summaryTable"></table>
          </div>
          <h2>Emissions</h2>
          <div id="emissionsReportTableWrapper">
              <table id="emissionsCostsTable"></table>
          </div>
      `;
    div.innerHTML = html;

    L.DomEvent.disableScrollPropagation(div);
    L.DomEvent.disableClickPropagation(div);

    return div;
  };
  resultControl.addTo(map);
The code below will add the different emissions metrics in a container.
const units = {
  fuelConsumption: "kg",
  co2eTankToWheel: "kg",
  co2eWellToWheel: "kg",
  energyUseTankToWheel: "MJ",
  energyUseWellToWheel: "MJ",
  electricityConsumption: "kWh",
};

function displayResults(result) {
  $("#summaryTable")
    .append(getRow(["Distance", convertDistance(result.distance)]))
    .append(getRow(["Travel Time", convertTime(result.travelTime)]));
  $("#emissionsCostsTable")
    .append(getRow(["<b>Type</b>", "<b>Amount</b>"]));
  Object.keys(result.emissions).forEach((emissionResultKey) => {
    const emissionResult = result.emissions[emissionResultKey];
    Object.keys(emissionResult).forEach((key) =>
      $("#emissionsCostsTable")
        .append(getRow([key, `${emissionResult[key].toFixed(4)} ${units[key]}`]))
    )
  });
}

function clearResults() {
  if (polylineLayer) {
    map.removeLayer(polylineLayer);
  }
  $("#summaryTable").empty();
  $("#emissionsCostsTable").empty();
}

function getRow(columns) {
  let row = "";
  columns.forEach((col) => {
    row += "<td>" + col + "</td>";
  });
  return $.parseHTML("<tr>" + row + "</tr>");
}
Next steps to try
In order to learn more about emissions, please refer to the PTV Developer Emissions API concept page and the PTV Developer Emissions API code samples.