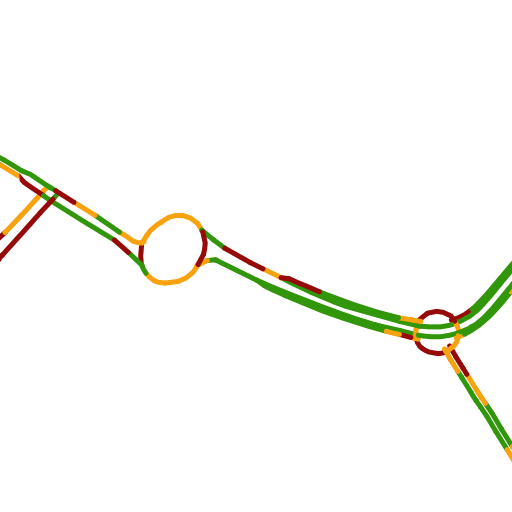
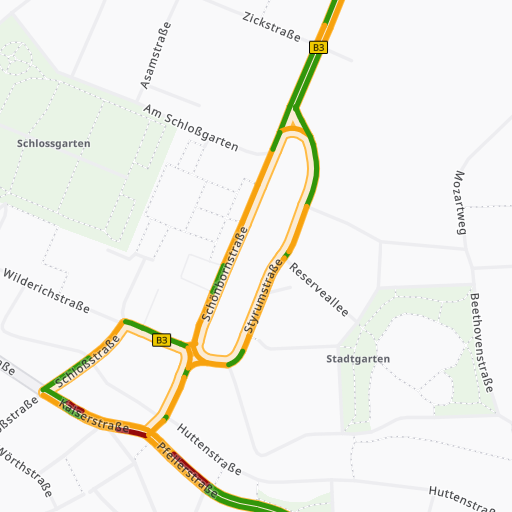
Traffic patterns represent the traffic flow based on historical and statistical data. The data contains speeds for each week day in a 15 minute time span grid.
API endpoint
You need the following API endpoint to request traffic patterns:
https://api.myptv.com/maps/overlays/v1/vector-tiles/Request
For a single tile showing Paris, France specify the map tile path with zoomLevel, x and y as shown below. If no reference time is given, the service will use the current UTC time as reference time.
You can test this by entering the URL into your web browser. Be sure to replace YOUR_API_KEY with your actual API key.
https://api.myptv.com/maps/overlays/v1/vector-tiles/11/1037/704?layers=trafficPatterns&referenceTime=2024-03-11T10:41:34Z&apiKey=YOUR_API_KEYResponse
The call result is a single map tile in MapBox Vector Tiles format.

Tile content
The requested vector tile contains data which is listed in this table. The individual columns are explained below.
| Name of content | Type |
| geometry | SRID 3857 |
| speed | integer |
| display_category | integer |
| direction | boolean |
| driving_side | string |
Speed
Defines the relative speed on a road segment for a driving direction. It is a value between 0 and 100, the calculation formula is current speed / free flow speed * 100.
Display category
Defines the importance of a road segment that contains a traffic pattern. Road segments with a high priority are displayed earlier than road segments with a lower priority.
| Display category | Meaning |
| 1 | The most important road segments like motorways and two-lane federal highways |
| 2 | Road segments of medium importance like single-lane federal highways or land roads. |
| 3 | All other road segments. |
Direction
Defines the direction of the traffic pattern relative to road segment drawing direction.
| Direction | Meaning |
| false | Traffic pattern in drawing direction of the road segment |
| true | Traffic pattern against drawing direction of the road segment |
Driving side
Defines if the road segment has left- or right-hand traffic.
| Driving Side | Meaning |
| L | Left-hand traffic |
| R | Right-hand traffic |
Styling
Traffic patterns are shown as lines in green, orange and red, symbolizing the average driving speed in relation to the free flow driving speed.

Layer names
Our predefined layer styles have a recurring naming scheme. All traffic pattern layers start with TSP_TrafficPatterns_.
| Layer name | Description |
| TSP_TrafficPatterns_Against_Direction_Major | Defines the style for patterns against the drawing direction of the segment on major priority roads. |
| TSP_TrafficPatterns_In_Direction_Major | Defines the style for patterns in drawing direction of the segment on major priority roads. |
| TSP_TrafficPatterns_Against_Direction_Medium | Defines the style for patterns against the drawing direction of the segment on medium priority roads. |
| TSP_TrafficPatterns_In_Direction_Medium | Defines the style for patterns in drawing direction of the segment on medium priority roads. |
| TSP_TrafficPatterns_Against_Direction_Minor | Defines the style for patterns against the drawing direction of the segment on minor priority roads. |
| TSP_TrafficPatterns_In_Direction_Minor | Defines the style for patterns in drawing direction of the segment on minor priority roads. |
How to implement
The tutorial on how to integrate overlays into a Vector Map also addresses traffic patterns.