In this tutorial you will learn how our simple Matrix Calculation App is implemented. The app computes a matrix calculation with the help of the Matrix Routing API. It results in a distance, travel time and or toll cost matrix displayed in a table. To focus solely on the core principles, we have implemented a basic error handling only. The objective of the code examples is to illustrate the use of the PTV Developer Matrix Routing API.
Prerequisites
- JavaScript knowledge, including up-to-date knowledge of ES6 features.
- Basic knowledge of JavaScript asynchronous programming using Promises.
- HTML page for displaying PTVs Vector Map with Leaflet. For help, please visit this Quick Start on Vector Maps.
How to use this tutorial
This tutorial is intended to introduce how to use the PTV Developer Matrix Routing API with JavaScript.
Getting started
- Request an API key:
- Register and login at myptv.com
- Activate PTV Developer
- Create your API key
- Download an editor such as Visual Studio Code or Atom which work with HTML and JavaScript.
- Look up more details of requests and responses in the respective reference manual.
- Read the Leaflet reference documentation for further information.
Overview of necessary steps
The following steps are required to compute a asynchronous matrix calculation:
- 1: Create a HTML page.
- 2: Create a style sheet.
- 2: Create JavaScript File, adding UI control elements to map.
- 3: Start an asynchronous matrix calculation.
- 4: Check the progress of the calculation.
- 5: Request the matrix.
For more detailed information on any specific step, please visit the PTV Developer Matrix Routing API Quick Start.
Create an HTML page to display a map
Create a new HTML file called index.html and initialize a Leaflet map using the code below.
<html>
    <head>
        <title>Matrix Routing</title>
        <link rel="stylesheet" href="https://unpkg.com/leaflet@1.6.0/dist/leaflet.css" />
        <link rel="stylesheet" href="style.css" />
        <script src="https://unpkg.com/leaflet@1.6.0/dist/leaflet.js"></script>
        <script src="https://ajax.googleapis.com/ajax/libs/jquery/3.6.0/jquery.min.js"></script>
        <script src="./matrixRouting.js"></script>
    </head>
    <body>
        <div id="map"></div>
        <script type="text/javascript" src="https://unpkg.com/maplibre-gl@2.1.9/dist/maplibre-gl.js" ></script>
        <script type="text/javascript" src="https://unpkg.com/@maplibre/maplibre-gl-leaflet@0.0.15/leaflet-maplibre-gl.js" ></script>
    </body>
</html>
Create a style sheet
Create a new style sheet file style.css for the elements displayed later on.
body,
html {
  border: 0;
  padding: 0;
  margin: 0;
}

table, th, td {
  border: 1px solid black;
  border-collapse: collapse;
}

#map {
  width: 100%;
  height: 100%;
}

.routing-control {
  background-color: #ffffff;
  width: 270px;
  padding: 0 30px 30px 30px;
  border-radius: 15px;
  box-shadow: 0 4px 8px 0 rgba(0, 0, 0, 0.2), 0 6px 20px 0 rgba(0, 0, 0, 0.19);
}

.result-control {
  background-color: #ffffff;
  width: 400px;
  min-height: 60px;
  padding: 0 30px 30px 30px;
  border-radius: 15px;
  box-shadow: 0 4px 8px 0 rgba(0, 0, 0, 0.2), 0 6px 20px 0 rgba(0, 0, 0, 0.19);
}

#distancesTable {
  width: 100%;
  text-align: center;
}

#traveTimeTable {
  width: 100%;
  text-align: center;
}

#tollCostTable {
  width: 100%;
  text-align: center;
}

.calc-btn {
  display: block;
  width: 100%;
  text-align: center;
}
Create JavaScript File
Create a new JavaScript file called matrixRouting.js. Add the code below and replace the string "YOUR_API_KEY" with your PTV Developer API key.
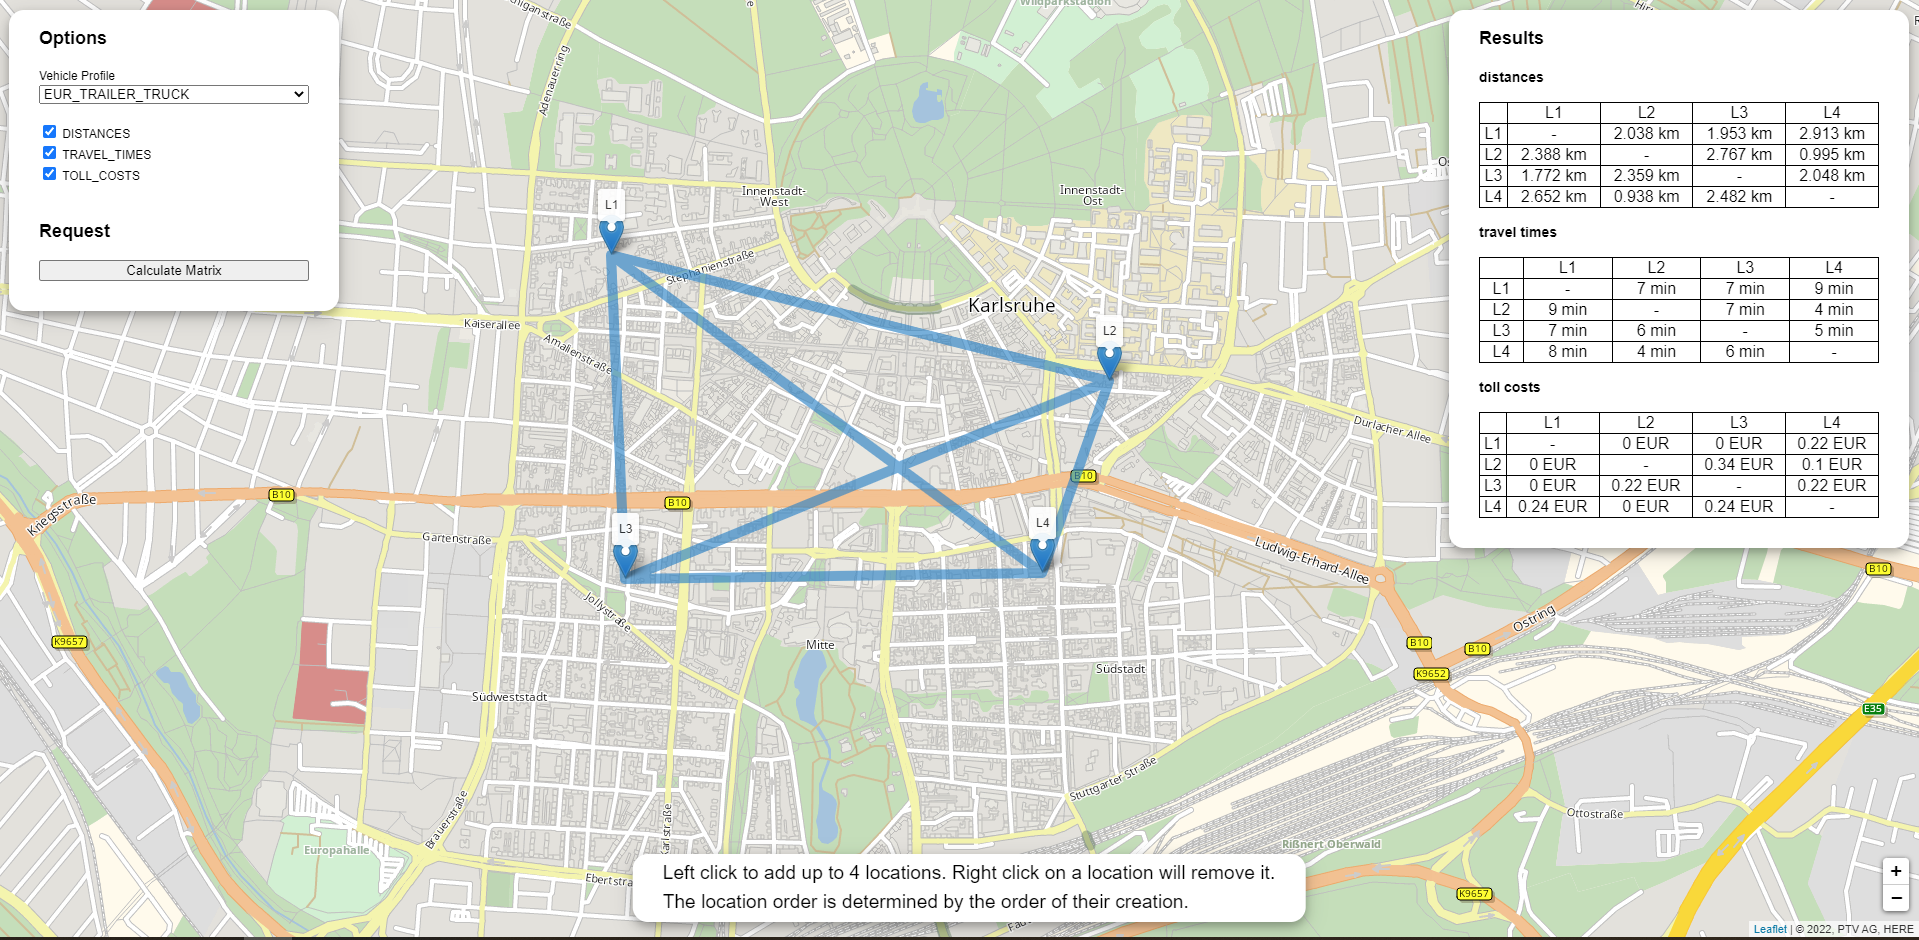
After loading the index.html file into a web browser, you should see a panable and zoomable map.
In addition you got some UI elements to change basic matrix options and are able to add locations by clicking the map.
$(document).ready(function() {

    const api_key = "YOUR_API_KEY";

    let locations = [];
    // add a location, the position you click on map
    function onMapClick(e) {
        const marker = L.marker(e.latlng).addTo(map);
        locations.push(marker);
    }

    //Lazy load the plugin to support right-to-left languages such as Arabic and Hebrew.
    maplibregl.setRTLTextPlugin(
        'https://api.mapbox.com/mapbox-gl-js/plugins/mapbox-gl-rtl-text/v0.2.3/mapbox-gl-rtl-text.js',
        null,
        true
    );

    // set of supported vehicle profiles
    const profiles = ['EUR_TRAILER_TRUCK','EUR_TRUCK_40T', 'EUR_TRUCK_11_99T', 'EUR_TRUCK_7_49T', 'EUR_VAN', 'EUR_CAR',
    'USA_1_PICKUP', 'USA_5_DELIVERY', 'USA_8_SEMITRAILER_5AXLE', 'AUS_LCV_LIGHT_COMMERCIAL', 'AUS_MR_MEDIUM_RIGID', 'AUS_HR_HEAVY_RIGID',
    'IMEA_TRUCK_40T', 'IMEA_TRUCK_7_49T', 'IMEA_VAN', 'IMEA_CAR'];

    let matrixPolygon = null;

    const coordinates = L.latLng(49, 8.4); // Karlsruhe, where Ptv is located
    const map = new L.Map('map', {
        center: coordinates,
        zoom: 13,
        maxZoom: 18,
        zoomControl: false
    });
    L.control.zoom({
        position: 'bottomright'
    }).addTo(map);

    map.on('click', onMapClick);
    const vectorLayer = L.maplibreGL({
        attribution: '© ' + new Date().getFullYear() + ' PTV Group, HERE',
        interactive:false,
        maxZoom: 18,
        style: 'https://vectormaps-resources.myptv.com/styles/latest/standard.json',
        transformRequest: (url, resourceType) => {
            if (resourceType === 'Tile' && url.startsWith('https://api.myptv.com')) {
                return {
                    url: url + '?apiKey=' + api_key
                }
            }
        }
    }).addTo(map);

    // UI controls
    addControls();
    addResultControl();

    function addControls() {
        const routingControl = L.control({position: 'topleft'});
        routingControl.onAdd = function(map) {
            const div = L.DomUtil.create('div', 'routing-control');
            const html = `
            <h2>Options</h2>
            <div>
                <div>
                    <label for="vehicleProfile" style="display: block;">Vehicle Profile</label>
                    <select name="vehicleProfile" id="vehicleProfile" style="display: block; width: 100%;">
                        ${
                            profiles.map((profile)=>{
                                return `<option value="${profile}">${profile}</option>`;
                            })
                        }
                    </select>
                </div>
                <br />
                <div>
                <input class="checkbox-type" type="checkbox" id="cb_distances" checked="true" value="DISTANCES" />
                <label for="distances">DISTANCES</label>
                </div>
                <div>
                    <input class="checkbox-type" type="checkbox" id="cb_travelTimes" checked="true" value="TRAVEL_TIMES" />
                    <label for="travelTimes">TRAVEL_TIMES</label>
                </div>
                <div>
                    <input class="checkbox-type" type="checkbox" id="cb_tollCosts" checked="true" value="TOLL_COSTS" />
                    <label for="toll costs">TOLL_COSTS</label>
                </div>
                <br />
                <h2>Request</h2>
                <button type="button" id="btnSendRequest" class="calc-btn">Calculate Matrix</button>
            </div>
            `;
            div.innerHTML = html;

            L.DomEvent.disableScrollPropagation(div);
            L.DomEvent.disableClickPropagation(div);

            return div;
        };
        routingControl.addTo(map);
        document.getElementById('btnSendRequest').addEventListener('click', calculateMatrixAsynchronous);
    }

    function addResultControl() {
        const resultControl = L.control({position: 'topright'});
        resultControl.onAdd = function(map) {
            const div = L.DomUtil.create('div', 'result-control');
            const html = `
                <h2>Results</h2>
                <div id="ResultsWrapper">
                    <h3>distances</h3>
                    <table id="distancesTable"></table>
                    <h3>travel times</h3>
                    <table id="traveTimeTable"></table>
                    <h3>toll costs</h3>
                    <table id="tollCostTable"></table>
                </div>
            `;
            div.innerHTML = html;

            L.DomEvent.disableScrollPropagation(div);
            L.DomEvent.disableClickPropagation(div);

            return div;
        };
        resultControl.addTo(map);
    }

    function displayMatrixPolyline(polyline) {
        const myStyle = {
            'color': '#2882C8',
            'weight': 10,
            'opacity': 0.65
        };

        let latlngs = [];
        for (let idxSource = 0; idxSource < locations.length; idxSource++) {
            latlngs.push(locations[idxSource]._latlng);
            for (let idxDest = idxSource + 1; idxDest < locations.length; idxDest++) {
                latlngs.push(locations[idxDest]._latlng);
                latlngs.push(locations[idxSource]._latlng);
            }
        }

        matrixPolygon = L.polyline(latlngs, myStyle).addTo(map);;
        map.fitBounds(matrixPolygon.getBounds(), { padding: [50, 50] });
    }

    function convertTime(time) {
        const hours = time / 60 / 60;
        const rhours = Math.floor(hours);
        const minutes = (time - (rhours*60*60)) / 60;
        const rminutes = Math.round(minutes);

        if (rhours === 0) {
            return rminutes + ' min';
        }

        return rhours + ' h ' + rminutes + ' min';
    }

    function getRow(columns) {
        let row = '';
        columns.forEach((col) => {
            row += '<td>' + col + '</td>';
        });
        return '<tr>' + row + '</tr>';
    }

    async function calculateMatrixAsynchronous() {
        // will be completed the last step
    }
});
Start an asynchronous matrix calculation
Add the following code to start a matrix calculation with the chosen options and locations.
async function startMatrixCalculation() {
  if (locations.length == 0) {
    return null;
  }
  else {
    return fetch(
      "https://api.myptv.com/matrixrouting/v1/matrices/async" + getMatrixParameter(), {
        method: 'POST',
        headers: {
          'Content-Type': 'application/json',
          'ApiKey': api_key
        },
        body: getMatrixBody()
      }
    ).then((response) => response.ok ? response.json() : console.log(response))
  }
}

function getMatrixParameter() {
  let query = '?profile=' + document.getElementById('vehicleProfile').value;
  query += '&results=';
  var first = true;
  if (document.getElementById('cb_distances').checked) {
    query += document.getElementById('cb_distances').value;
    first = false;
  }
  if (document.getElementById('cb_travelTimes').checked) {
    if (!first) {
      query += ',';}
    query += document.getElementById('cb_travelTimes').value;
    first = false;
  }
  if (document.getElementById('cb_tollCosts').checked) {
    if (!first) {
      query += ',';}
    query += document.getElementById('cb_tollCosts').value;
  }
  return query;
}

function getMatrixBody() {
  let body = '{"origins": [';
  position = 0;
  locations.forEach((location) => {
    if (position != 0) {
      body += ','; }
    body += '{"latitude":' + location._latlng.lat + ',"longitude":' + location._latlng.lng + '}';
    position += 1;
  });
  body += ']}';
  return body;
}
Check the progress of the calculation
Add the following code to check the progress of the calculation.
function sleep(ms) {
  return new Promise(resolve => setTimeout(resolve, ms));
}

// polls the status until it is not "RUNNING" any more
async function getMatrixCalculationStatus(requestId) {
  var status = "RUNNING";
  while (status == "RUNNING") {
    await sleep(100);
    fetch(
        "https://api.myptv.com/matrixrouting/v1/matrices/status/" + requestId, {
          method: 'GET',
          headers: {
            'Content-Type': 'application/json',
            'ApiKey': api_key
          }
        }
    )
    .then((response) => response.json()
        .then((result) => {
          status = result.status;
        })
        .catch(err => {console.log(err.message); status = "exitnow";})
    );
  }
  return status;
}
Request the matrix
Add the following code to request the matrix and display result on map and controls.
function getMatrixResult(requestId) {
  fetch(
      "https://api.myptv.com/matrixrouting/v1/matrices/" + requestId, {
        method: 'GET',
        headers: {
          'Content-Type': 'application/json',
          'ApiKey': api_key
        }
      }
  )
  .then((response) => response.json()
      .then((result) => {
          displayMatrixPolyline();
          displayMatrixResults(result);
      })
      .catch(err => console.log(err.message)))
}

function clearMatrixPolygon() {
  if (matrixPolygon !== null) {
    map.removeLayer(matrixPolygon);
  }
}

function clearResults() {
  clearMatrixPolygon();

  $('#distancesTable').empty();
  $('#traveTimeTable').empty();
  $('#tollCostTable').empty();
}

function displayMatrixResults(result) {
  if (document.getElementById("cb_distances").checked) {
    cols = [];
    cols[0]='';
    for (run = 1; run <= locations.length; run++) {
      cols[run] = 'L' + (run);
    }
    row = getRow(cols);
    $('#distancesTable').append(row);

    const distances = result.distances;
    i = 0; j = 1;
    distances.forEach((distance) => {
      if (i == 0) {
        cols[0] = 'L' + j;
        j++;
      }
      i++;
      diagonal = (i+1) == j && distance == 0;
      if (diagonal) {
        cols[i] = '-';
      }
      else {
        cols[i] = distance/1000 + ' km';
      }
      if ( i%(locations.length) == 0) {
        i = 0;
        row = getRow(cols);
        $('#distancesTable').append(row);
      }
    });
  }

  if (document.getElementById("cb_travelTimes").checked) {
    cols = [];
    cols[0]='';
    for (run = 1; run <= locations.length; run++) {
      cols[run] = 'L' + (run);
    }
    row = getRow(cols);
    $('#traveTimeTable').append(row);

    const travelTimes = result.travelTimes;
    i = 0; j = 1;
    travelTimes.forEach((travelTime) => {
      if (i == 0) {
        cols[0] = 'L' + j;
        j++;
      }
      i++;
      diagonal = (i+1) == j && travelTime == 0;
      if (diagonal) {
        cols[i] = '-';
      }
      else {
        cols[i] = convertTime(travelTime);
      }
      if ( i%(locations.length) == 0) {
        i = 0;
        row = getRow(cols);
        $('#traveTimeTable').append(row);
      }
    });
  }

  if (document.getElementById("cb_tollCosts").checked) {
    cols = [];
    cols[0]='';
    for (run = 1; run <= locations.length; run++) {
      cols[run] = 'L' + (run);
    }
    row = getRow(cols);
    $('#tollCostTable').append(row);

    const tollCosts = result.tollCosts;
    i = 0; j = 1;
    tollCosts.forEach((tollCost) => {
      if (i == 0) {
        cols[0] = 'L' + j;
        j++;
      }
      i++;
      diagonal = (i+1) == j && tollCost == 0;
      if (diagonal) {
        cols[i] = '-';
      }
      else {
        cols[i] = (Math.floor(tollCost * 100) / 100)  + ' EUR';
      }
      if ( i%(locations.length) == 0) {
        i = 0;
        row = getRow(cols);
        $('#tollCostTable').append(row);
      }
    });
  }
}
Replace implementation of function calculateMatrixAsynchronous()
Now just make everything work together by implementing function calculateMatrixAsynchronous(). So replace the empty implementation with the following. Then choose some locations, push the button "Calculate Matrix" and enjoy your first matrix calculation.
async function calculateMatrixAsynchronous() {
  clearResults();
  const responseStart = await startMatrixCalculation();
  if (responseStart == null) {
    return;
  }
  var status = await getMatrixCalculationStatus(responseStart.id);
  if (status == "SUCCEEDED") {
    getMatrixResult(responseStart.id);
  }
}