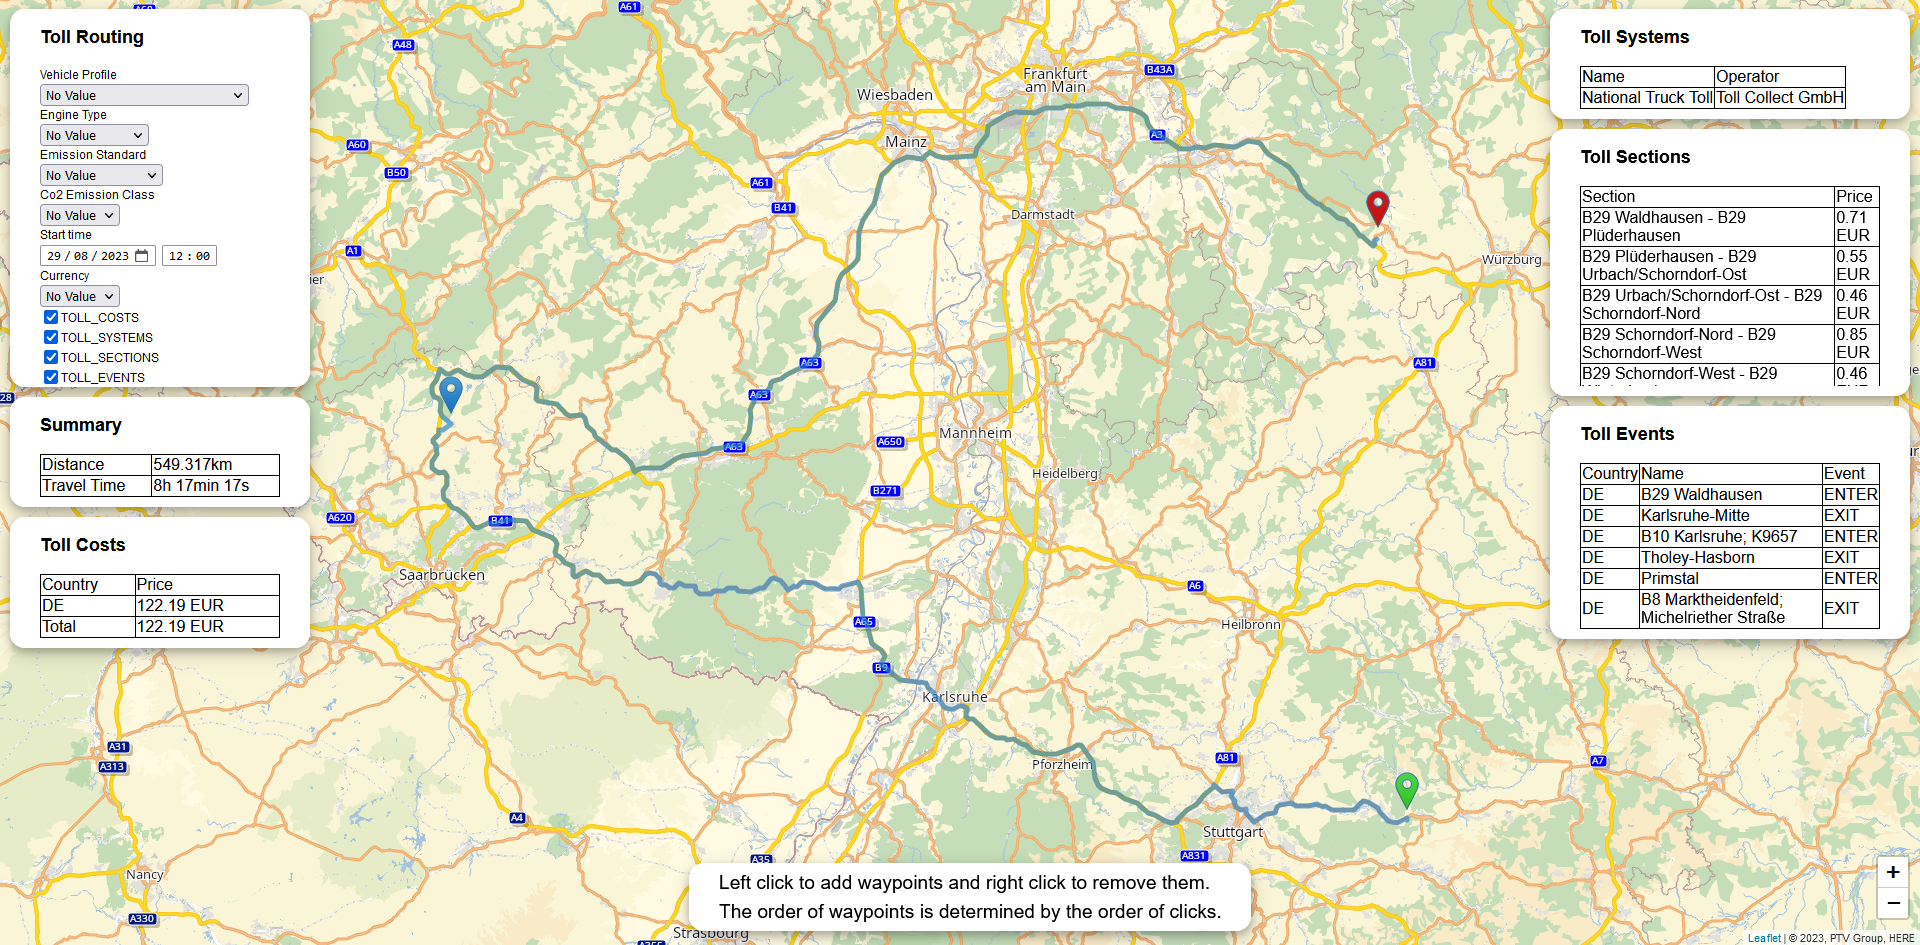
In this tutorial you will learn how a Toll Calculation App is implemented. It will allow to display a map, select and calculate a route with toll between waypoints. The aim of the code examples is to illustrate the use of the toll use case of PTV Developer Routing API.
Prerequisites
- Basic JavaScript knowledge.
- Basic knowledge of JavaScript asynchronous programming using Promises.
- Helpful: Basic knowledge of jQuery. A page like the W3 Schools jQuery tutorial is sufficient.
How to use this tutorial
The tutorial will start similar to a cooking recipe. After the basic steps how to create the app are explained, the tutorial will focus on the major building blocks.
Getting started
- Request an API key:
- Register and login at myptv.com
- Activate PTV Developer
- Create your API key
- Download an editor like Visual Studio Code or Atom to work on HTML and JavaScript.
- Look up more details of requests and responses in the respective reference manual.
- Read the Leaflet reference documentation for further information.
Create an HTML page to display a map
Create a new HTML file called index.html and initialize a Leaflet map using the code below.
<html>
  <head>
    <title>Toll Calculation</title>
    <link rel="stylesheet" href="https://unpkg.com/leaflet@1.6.0/dist/leaflet.css" />
    <link rel="stylesheet" href="style.css" />
    <script src="https://unpkg.com/leaflet@1.6.0/dist/leaflet.js"></script>
    <script src="https://ajax.googleapis.com/ajax/libs/jquery/3.6.0/jquery.min.js"></script>
    <script src="./tollRouting.js"></script>
    </head>
      <body>
          <div id="map"></div>
      </body>
</html>
Create JavaScript File
Create a new JavaScript file called tollRouting.js. Add the code below and replace the string "YOUR_API_KEY" with your PTV Developer API key. After loading the index.html file into a web browser, you should see a panable and zoomable map.
$(document).ready(function() {
    const api_key = "YOUR_API_KEY";
    const tileURL = `https://api.myptv.com/rastermaps/v1/image-tiles/{z}/{x}/{y}?apiKey=${api_key}&layers=background,transport,labels,toll`;
    const routingURL = "https://api.myptv.com/routing/v1/routes";
    const coordinates = L.latLng(49.0, 8.4);
    var startPosition = null;
    var destinationPosition = null;
    var routingURLObj = new URL(routingURL);
    var geoURLObj = new URL(geoURL);
    var map = new L.Map('map', {
        center: coordinates,
        zoom: 13,
        zoomControl: false
    });
    L.control.zoom({
        position: 'bottomright'
    }).addTo(map);
    var tileLayer = new L.tileLayer(tileURL, {
        attribution: '©2024, PTV Logistics, HERE'
    }).addTo(map);
});
Explanation of the important code lines
This jQuery expression indicates that the code inside the curly brackets is executed only if the root index.html file is completely loaded.
$(document).ready(function() {
    ...
});
The first argument given to the L.Map constructor references the DOM element with the id map. The following lines show how a leaflet map control like zooming is created.
var map = new L.Map('map', {
    center: coordinates,
    zoom: 13,
    zoomControl: false
});
L.control.zoom({
    position: 'bottomright'
}).addTo(map);
The expressions {z}/{x}/{y} in the tileURL are placeholders which are replaced by default. The request parameter "layers" tells the Raster Maps API which layers you want to display.
const tileURL = `https://api.myptv.com/rastermaps/v1/image-tiles/{z}/{x}/{y}?apiKey=${api_key}&layers=background,transport,labels,toll`; More information on this can be found in the Raster Maps API Documentation
All other replacements have to be defined in the constructor parameters of L.tileLayer.
var tileLayer = new L.tileLayer(tileURL, {
    attribution: '©2024, PTV Logistics, HERE'
}).addTo(map);
The rendered HTML page constitutes already an interactive zoom-able and pan-able map. The next section shows how to create input controls for start and destination.
Adding Waypoints to the Map
To set waypoints on the map a event handler has to be registered:
$(document).ready(function () {
    ...
    map.on('click', onMapClick);
Then implement the event handler. Additionally an event handler for the waypoint is implemented. It triggers when right clicking a waypoint and removes it.
function onMapClick(e) {
    var marker = L.marker(e.latlng).addTo(map);
    marker.on('contextmenu', removeMarker)
}
function removeMarker(e) {
    map.eachLayer((layer) => {
        if (layer instanceof L.Marker && layer._latlng === e.latlng) {
            layer.remove();
        }
    });
}
Adding controls to manipulate the toll calculation
Beginning from this step, we will focus on the most important chunks of the source code.
The following function adds controls for the vehicle Profile and for the toll results.
function addControls() {
    const routingControl = L.control({ position: 'topleft' });
    routingControl.onAdd = function (map) {
        const div = L.DomUtil.create('div', 'routing-control');
		const html = `
				<h2>Toll Calculation</h2>
		<div>
		  <label for="vehicleProfile" style="display: block;">Vehicle Profile</label>
		  <select name="vehicleProfile" id="vehicleProfile" style="display: block;">
		    <option value="">No Value</option>
		    <option value="EUR_TRAILER_TRUCK">EUR_TRAILER_TRUCK</option>
		    <option value="EUR_TRUCK_40T">EUR_TRUCK_40T</option>
		    <option value="EUR_TRUCK_11_99T">EUR_TRUCK_11_99T</option>
		    <option value="EUR_TRUCK_7_49T">EUR_TRUCK_7_49T</option>
		    <option value="EUR_VAN">EUR_VAN</option>
		    <option value="EUR_CAR">EUR_CAR</option>
		    <option value="USA_8_SEMITRAILER_5AXLE">USA_8_SEMITRAILER_5AXLE</option>
		    <option value="USA_5_DELIVERY">USA_5_DELIVERY</option>
		    <option value="USA_1_PICKUP">USA_1_PICKUP</option>
		    <option value="AUS_LCV_LIGHT_COMMERCIAL">AUS_LCV_LIGHT_COMMERCIAL</option>
		    <option value="AUS_MR_MEDIUM_RIGID">AUS_MR_MEDIUM_RIGID</option>
		    <option value="AUS_HR_HEAVY_RIGID">AUS_HR_HEAVY_RIGID</option>
		    <option value="IMEA_TRUCK_40T">IMEA_TRUCK_40T</option>
		    <option value="IMEA_TRUCK_7_49T">IMEA_TRUCK_7_49T</option>
		    <option value="IMEA_VAN">IMEA_VAN</option>
		    <option value="IMEA_CAR">IMEA_CAR</option>
		  </select>
		</div>
		<div>
		  <label for="co2EmissionClass" style="display: block;">Co2 Emission Class</label>
		  <select name="co2EmissionClass" id="co2EmissionClass" style="display: block;">
		    <option value="">No Value</option>
		    <option value="1">1</option>
		    <option value="2">2</option>
		    <option value="3">3</option>
		    <option value="4">4</option>
		    <option value="5">5</option>
		  </select>
		</div>
		<div>
		  <label for="engineType" style="display: block;">Engine Type</label>
		  <select name="engineType" id="engineType" style="display: block;">
		    <option value="">No Value</option>
		    <option value="COMBUSTION">COMBUSTION</option>
		    <option value="ELECTRIC">ELECTRIC</option>
		    <option value="HYBRID">HYBRID</option>
		  </select>
		</div>
		<div>
		  <label for="emissionStandard" style="display: block;">Emission Standard</label>
		  <select name="emissionStandard" id="emissionStandard" style="display: block;">
		    <option value="">No Value</option>
		    <option value="NONE">NONE</option>
		    <option value="EURO_0">EURO_0</option>
		    <option value="EURO_1">EURO_1</option>
		    <option value="EURO_2">EURO_2</option>
		    <option value="EURO_3">EURO_3</option>
		    <option value="EURO_4">EURO_4</option>
		    <option value="EURO_5">EURO_5</option>
		    <option value="EURO_EEV">EURO_EEV</option>
		    <option value="EURO_6">EURO_6</option>
		    <option value="EURO_6C">EURO_6C</option>
		    <option value="EURO_6D_TEMP">EURO_6D_TEMP</option>
		    <option value="EURO_6D">EURO_6D</option>
		    <option value="EURO_6E">EURO_6E</option>
		    <option value="EURO_7">EURO_7</option>
		  </select>
		</div>
		<div>
		  <span>Reference time</span>
		  <table style="border: none;">
		    <tr>
		      <td height="20px" style="text-align:right; padding: 0px 5px 0px 0px; border: none;">
		        <input type="date" id="referenceDate" value="2023-08-29" />
		      </td>
		      <td height="20px" style="text-align:right; border: none;">
		        <input type="time" id="referenceTime" value="12:00" />
		      </td>
		    </tr>
		  </table>
		</div>
		<div>
		  <label for="currency" style="display: block;">Currency</label>
		  <select name="currency" id="currency" style="display: block;">
		    <option value="">No Value</option>
		    <option value="USD">USD</option>
		    <option value="EUR">EUR</option>
		    <option value="CHF">CHF</option>
		    <option value="PLN">PLN</option>
		    <option value="GBP">GBP</option>
		  </select>
		</div>
		<div>
		  <input type="checkbox" id="TOLL_COSTS" checked>
		  <label for="TOLL_COSTS">TOLL_COSTS</label>
		</div>
		<div>
		  <input type="checkbox" id="TOLL_SYSTEMS">
		  <label for="TOLL_SYSTEMS">TOLL_SYSTEMS</label>
		</div>
		<div>
		  <input type="checkbox" id="TOLL_SECTIONS">
		  <label for="TOLL_SECTIONS">TOLL_SECTIONS</label>
		</div>
		<div>
		  <input type="checkbox" id="TOLL_EVENTS">
		  <label for="TOLL_EVENTS">TOLL_EVENTS</label>
		</div>
`	;
    routingControl.addTo(map);
    document.getElementById("TOLL_COSTS").addEventListener("click", fetchRoute);
    document.getElementById("TOLL_SYSTEMS").addEventListener("click", fetchRoute);
    document.getElementById("TOLL_SECTIONS").addEventListener("click", fetchRoute);
    document.getElementById("TOLL_EVENTS").addEventListener("click", fetchRoute);
    document.getElementById("vehicleProfile").addEventListener("change", fetchRoute);
}
Call the PTV Routing API
With fetchRoute(), a call to the PTV Routing API is made.
function fetchRoute() {
    const waypoints = [];
    map.eachLayer((layer)  => {
        if (layer instanceof L.Marker) {
            waypoints.push(layer._latlng);
        }
    });
    if (waypoints.length  > 1) {
        fetch(
            routingURL + getTollQuery(waypoints)),
            {
                method: "GET",
                headers: {
                    "Content-Type": "application/json",
                    "apiKey": api_key
                }
            })
            .then(response  => response.json()
                .then(result  &> {
                    displayPolyline(JSON.parse(result.polyline));
                    console.log(result);
                }));
    }
}
Explanation of the important code lines
First all Waypoints are found by retrieving its coordinates from leaflets map layers. Then, if there are more two or more waypoints the Routing API is called.
The function getTollQuery() returns the query for the request.
function getTollQuery(waypoints) {
    var tollQuery = "?results=POLYLINE";
    var tollResults = [];

    if (document.getElementById("TOLL_COSTS").checked) {
        tollResults.push("TOLL_COSTS");
    }
    if (document.getElementById("TOLL_SYSTEMS").checked) {
        tollResults.push("TOLL_SYSTEMS");
    }
    if (document.getElementById("TOLL_SECTIONS").checked) {
        tollResults.push("TOLL_SECTIONS");
    }
    if (document.getElementById("TOLL_EVENTS").checked) {
        tollResults.push("TOLL_EVENTS");
    }

    if (tollResults.length > 0) {
        tollQuery += "," + tollResults.join();
    }
    if (document.getElementById("vehicleProfile").value !== "") {
        tollQuery += "&profile=" + document.getElementById("vehicleProfile").value;
    }
    if (document.getElementById("co2EmissionClass").value !== "") {
        tollQuery += "&vehicle[co2EmissionClass]=" + parseInt(document.getElementById("co2EmissionClass").value);
    }
    if (document.getElementById("currency").value !== "") {
        tollQuery += "&options[currency]=" + document.getElementById("currency").value;
    }
    if (document.getElementById("emissionStandard").value !== "") {
         tollQuery += "&vehicle[emissionStandard]=" + document.getElementById("emissionStandard").value;
    }
    if (document.getElementById("referenceTime").value !== "" && document.getElementById("referenceDate").value) {
        const date = new Date(document.getElementById('referenceDate').value + 'T' + document.getElementById('referenceTime').value).toISOString()
        tollQuery += "&options[startTime]=" + date
    }

    waypoints.forEach(waypoint => {
        tollQuery += "&waypoints=" + waypoint.lat + "," + waypoint.lng;
    });

    // e.g. ?results=POLYLINE&results=TOLL_COSTS&profile=...
    //          &options[currency]=EUR&waypoints=...&waypoints=...
    return tollQuery;
}
After the fetch method is finished, the response will then be converted to JSON. In the next line, the polyline will be displayed on the map.
.then(response => response.json()
    .then(result => {
        displayPolyline(map, JSON.parse(result.polyline));
    }));
The function displayPolyline contains the style of the polyline. We use the polyline in the geoJSON format as provided by the response of the routing API call.
var polylineLayer = null;
function displayPolyline(polyline) {
    if (polylineLayer !== null) {
        map.removeLayer(polylineLayer);
    }

    var myStyle = {
        "color": '#2882C8',
        "weight": 5,
        "opacity": 0.65
    };

    polylineLayer = L.geoJSON(polyline, {
        style: myStyle
    }).addTo(map);

    map.fitBounds(polylineLayer.getBounds());
}
Add Stylesheet
Create a new file called style.css. and put the following code in it.
#map {
    width: 100%;
    height: 100%;
}

.routing-control {
    background-color: #ffffff;
    width: 270px;
    height: 220px;
    padding-left: 30px;
    border-radius: 15px;
    box-shadow: 0 4px 8px 0 rgba(0, 0, 0, 0.2), 0 6px 20px 0 rgba(0, 0, 0, 0.19);
}
How to display the result
To display the result a control can be added to the map as previously done in the step Adding controls to manipulate the toll calculation. As example the toll sections will be displayed.
function addSectionResultControl() {
    const resultControl = L.control({ position: 'topright' });
    resultControl.onAdd = function (map) {
        const div = L.DomUtil.create('div', 'result-control');
        const html = `
        <h2>Toll Sections</h2>
        <div id="tollReportTableWrapper">
            <table id="tollSectionsTable"></table>
        </div>
    `;
        div.innerHTML = html;

        L.DomEvent.disableScrollPropagation(div);
        L.DomEvent.disableClickPropagation(div);

        return div;
    };
    resultControl.addTo(map);
}
The code below will add the toll sections and their price to the container. If a currency option was used in the request the selected currency will be displayed instead of the toll sections local currency. For the sake of this tutorial the display of the result is simplyfied.
Please note that for the sake of this tutorial the display of the result is simplyfied. When routing through multiple countries with different currency without using a currency option this function might not display the result correctly.
function displayTollSections(sections) {
    $("#tollSectionsTable").append($.parseHTML(getRow(["Section", "Price"])));
    sections.forEach((section) => {
        let price = 0;
        let currency = "";
        if (section.costs[0].convertedPrice) {
            section.costs.forEach((c) => {
                price += c.convertedPrice.price;
            });
            currency = section.costs[0].convertedPrice.currency;
        } else {
            section.costs.forEach((c) => {
                price += c.price;
            });
            currency = section.costs[0].currency;
        }
        $("#tollSectionsTable").append($.parseHTML(getRow([section.displayName, price + " " +  currency])));
    });
}

function getRow(columns) {
    var row = '';
    columns.forEach(col => {
        row += '<td>' + col + '</td>'
    });
    return '<tr>' + row + '</tr>'
}
Add the styling for the result control to style.css.
#tollReportTableWrapper {
    overflow: auto;
    max-height: 200px;
}

.result-control {
    background-color: #ffffff;
    width: 300px;
    min-height: 60px;
    max-height: 260px;
    padding-left: 30px;
    padding-right: 30px;
    padding-bottom: 10px;
    border-radius: 15px;
    box-shadow: 0 4px 8px 0 rgba(0, 0, 0, 0.2), 0 6px 20px 0 rgba(0, 0, 0, 0.19);
}